What is observability?
Observability refers to the ability to monitor & understand the internals of a software system — it’s crucial for detecting & diagnosing issues. In the context of LLM app development, observability is even more relevant. That’s because LLMs part of building a great LLM app is, at least, 80% trying new prompts, new RAG pipelines, different agent behaviours, etc. RΞASON follows the OpenTelemetry standard. The OpenTelemetry is a open standard for obversability that prevents vendor lock-in and interops with a bunch of different tools — allowing you to choose the best tool for you.Why OpenTelemetry is a big deal?
OpenTelemetry is a standard in the industry, having your app data in it, means you can use any tool you want to monitor your app. You are not locked-in into whatever tool RΞASON supports or into depending that RΞASON integrates with a provider you want to use. If you already have data pipelines configured, you don’t need to change a single thing. Your RΞASON app data will automatically work there too.Using it with RΞASON
There are a bunch of tools that integrate with OpenTelemetry data — both free & paid. You can use whichever you prefer. However, by default RΞASON uses Zipkin: a free open-source tracing tool developed by Twitter.What if you don’t want to use Zipkin? This is covered below.
Starting Zipkin
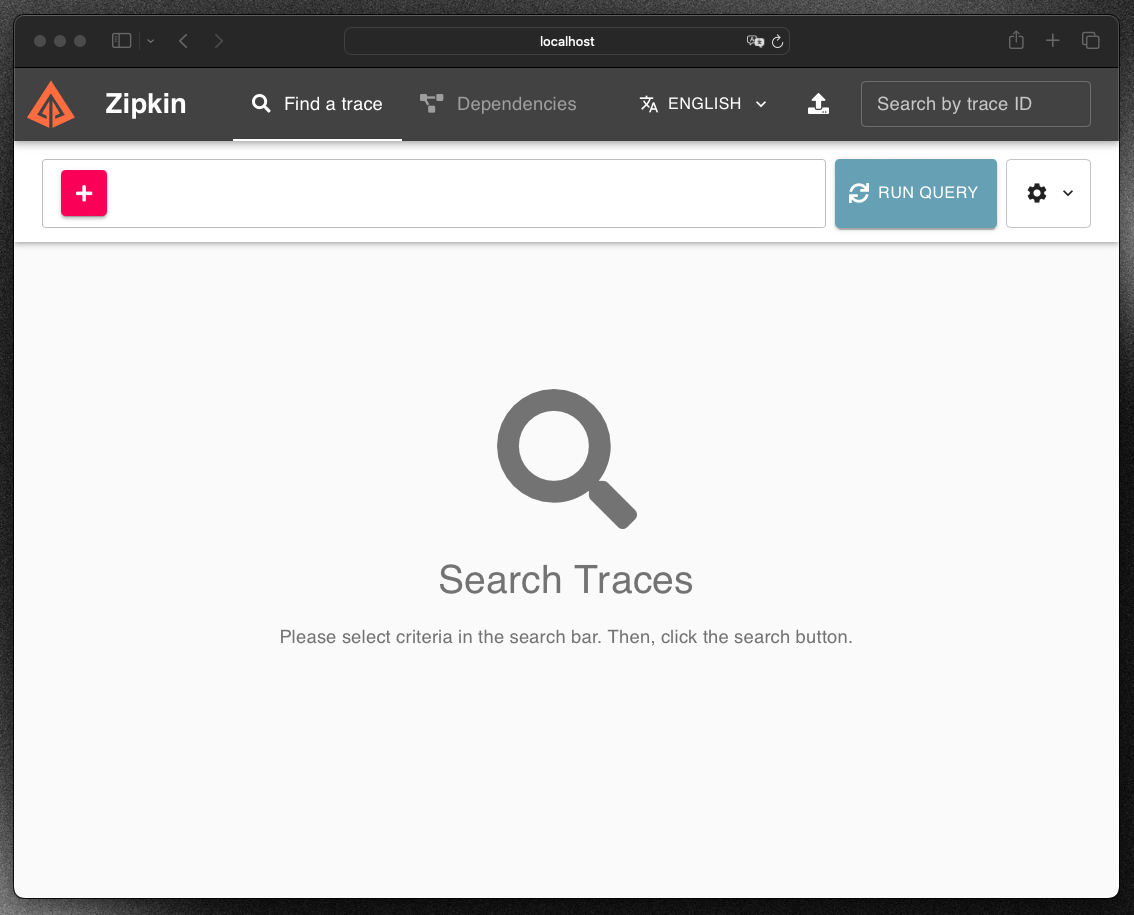
Zipkin dashboard
MathAgent we created in the Agents page using the RΞASON Playground:
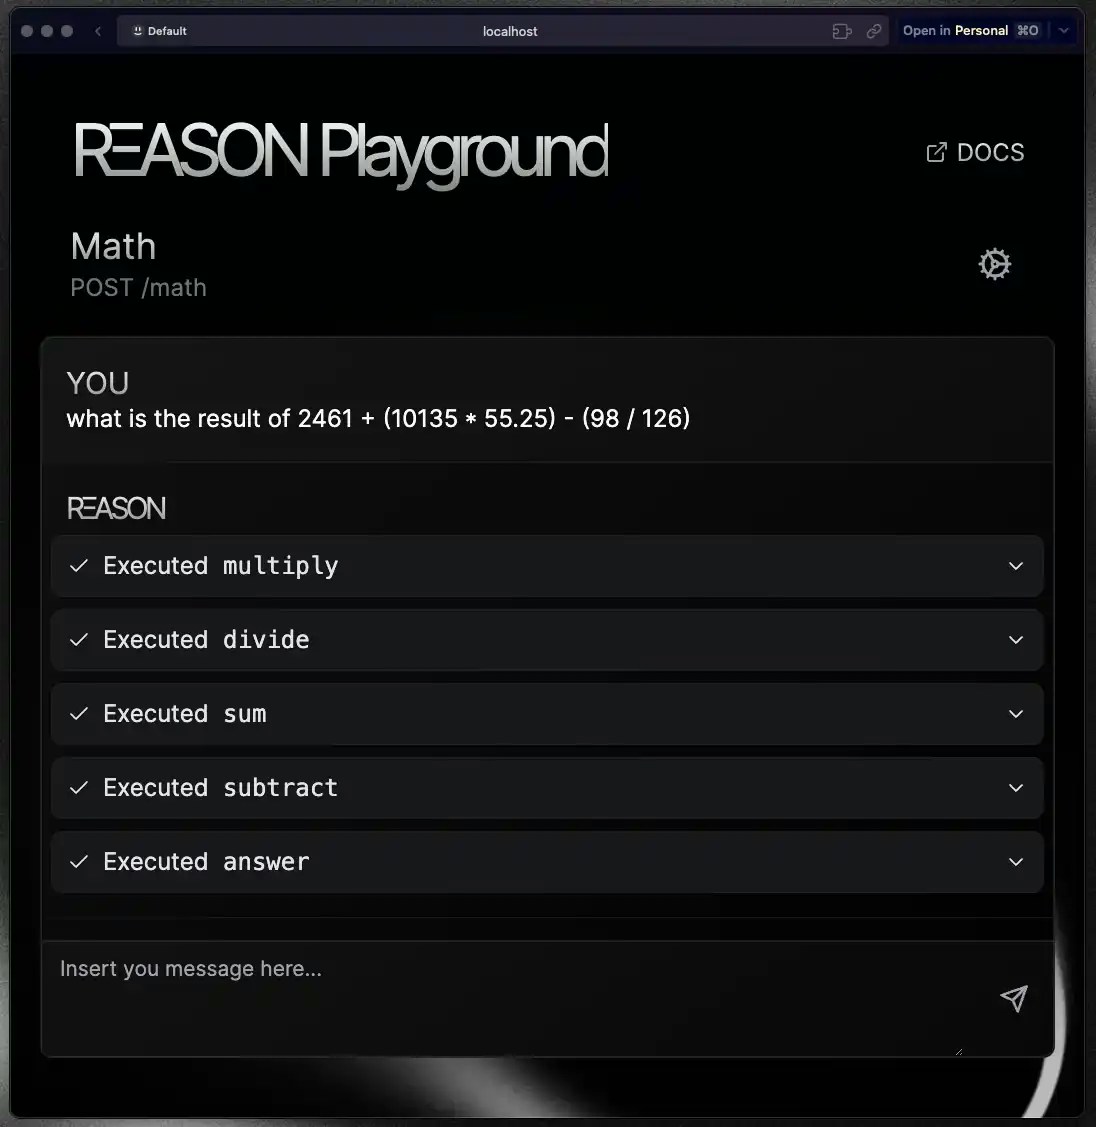
MathAgent responding
RUN QUERY button in Zipkin:
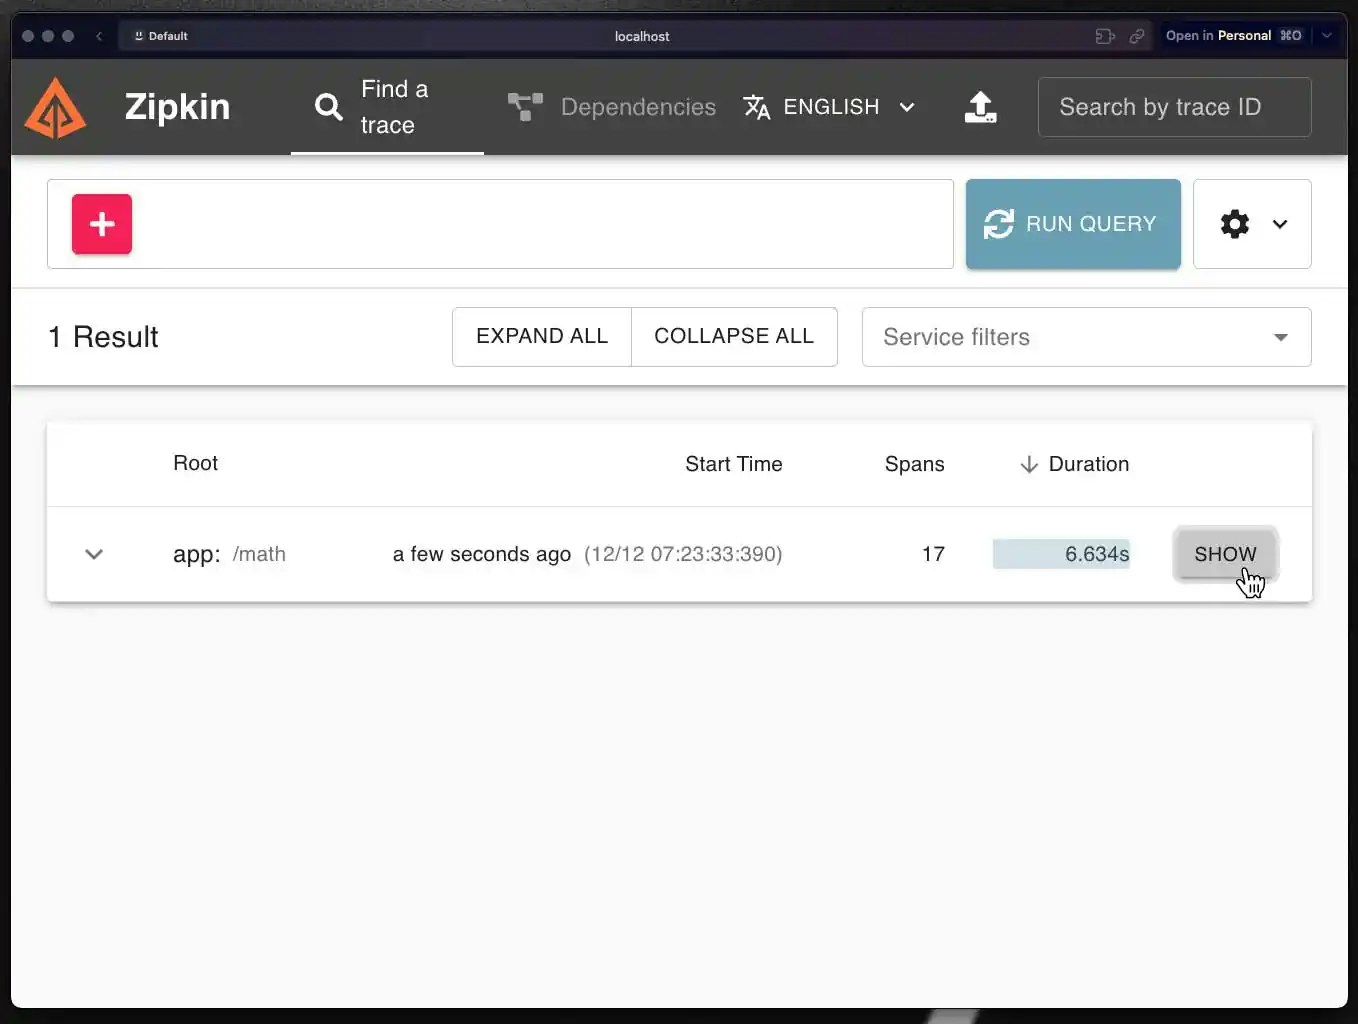
Zipkin dashboard with a trace
SHOW will open the trace:
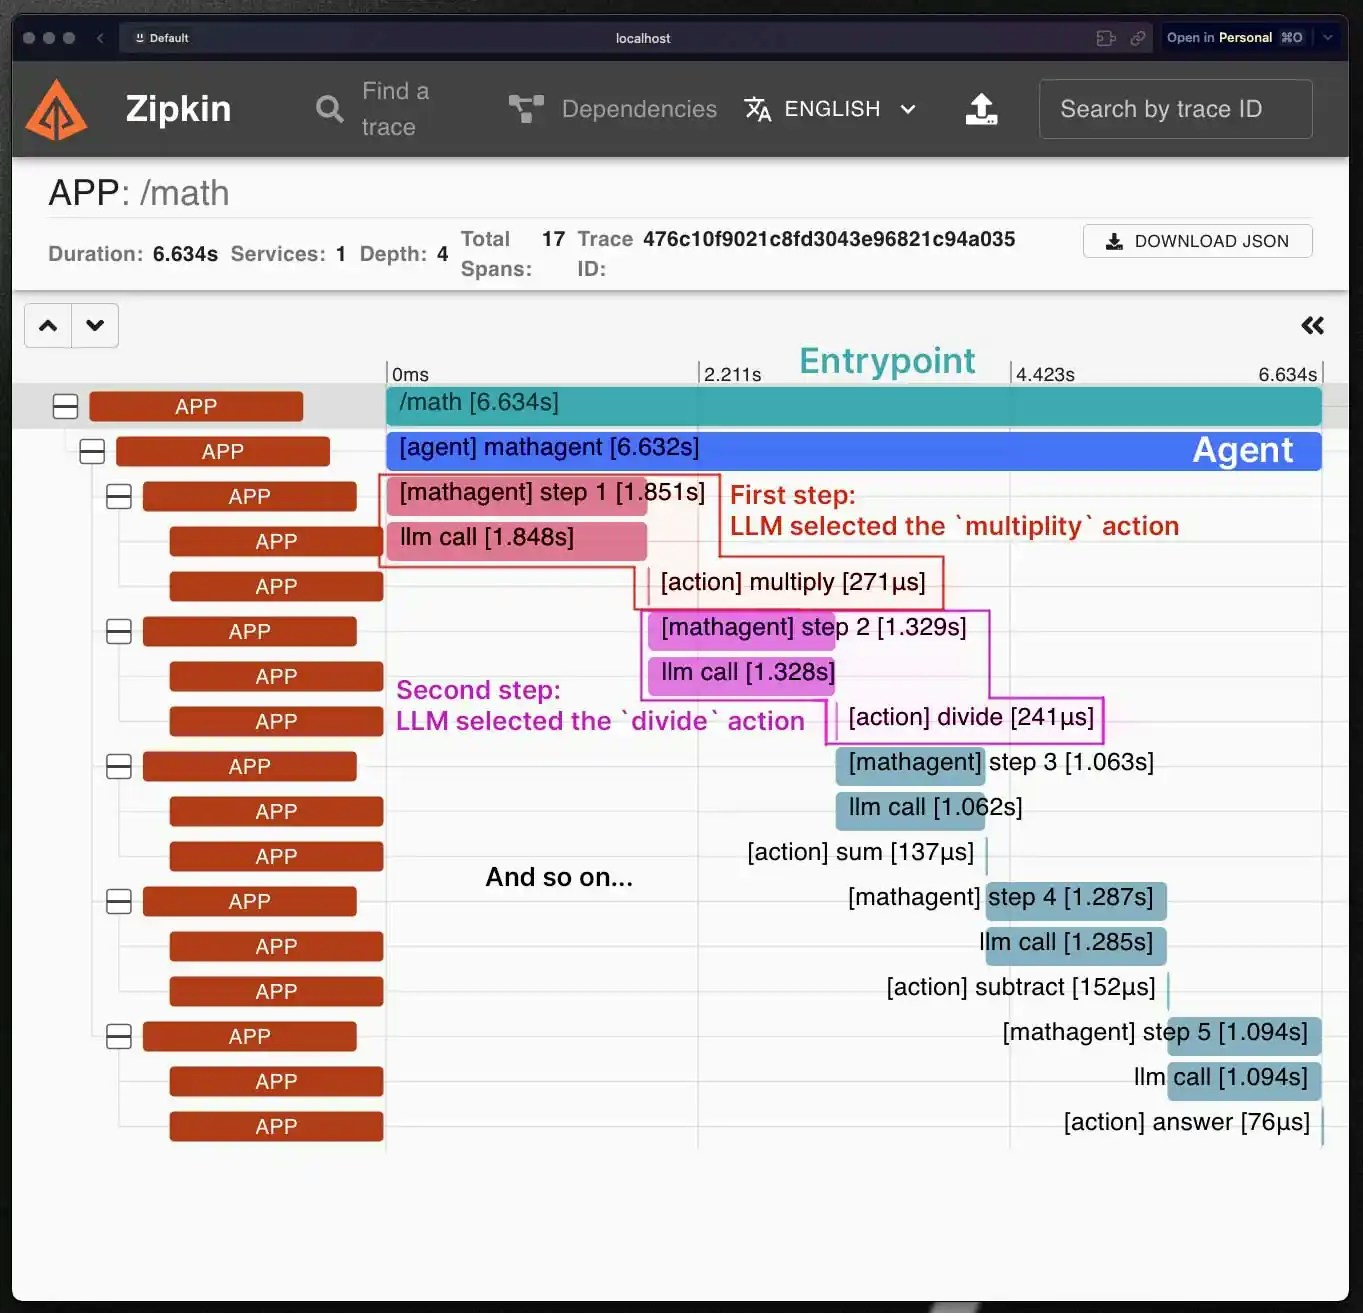
A Zipkin trace
POST /math — it is an icicle graph.
It shows the time each took during your entrypoint execution. It also shows the inputs & outputs.
You can click in any of the spans (the rectangles in the graph) to open more information about it. Let’s open the multiply action:
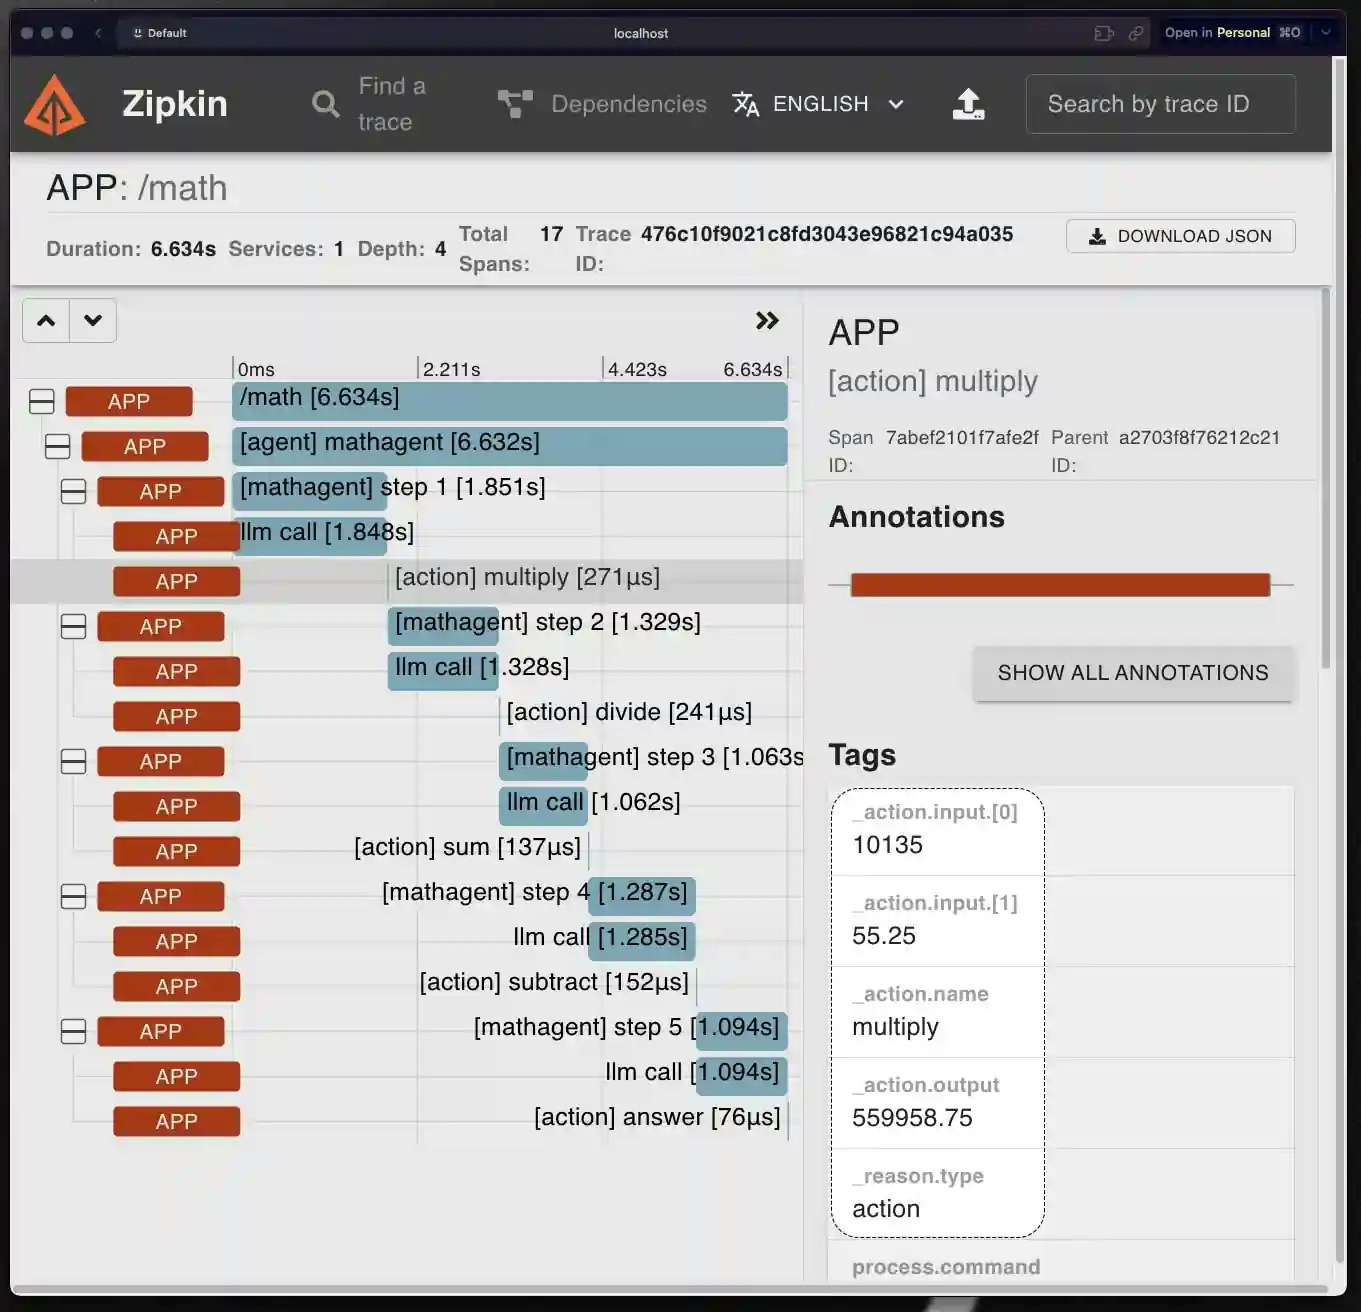
Multiplity action span
Using other OpenTelemetry providers
In the previous example you saw how to use Zipkin with RΞASON, however since RΞASON supports the OpenTelemetry standard, you can use many other tools if you prefer. To do that, you just need to add a newopenTelemetryExporter in .reason.config.js. Let’s say you want to use Jaeger:
.reason.config.js